Saturday, January 8, 2011

2011: Housing, Jobs, Stocks, Commodities And US Dollar

As the global economy shows continued signs of a sustainable economic recovery, there are two notable areas lagging behind; employment and housing in the United States. Continued trends in these areas could lead to renewed weakness in the U.S. dollar, which in turn could help boost stock and commodity prices. From a December 26th Bloomberg article:

A wave of foreclosures waiting to reach the market means home prices will remain under pressure in 2011, representing a risk to household finances. Rising equity values and an improving job market will probably help offset the damage, ensuring that confidence and spending continue to climb. "The inventory overhang is so big, with foreclosures looming, it'll take five years to absorb the supply," said Paul Ballew, chief economist at Nationwide Mutual Insurance Co. in Columbus, Ohio. "The consumer is feeling better although there is still a high level of caution and anxiety."

According to a December 29th NPR article:

Mark Zandi, chief economist at Moody's Analytics, says in 2010 the labor market was running hard, but going nowhere. The economy needs to generate about 150,000 jobs a month, Zandi says, just to keep up with population growth and people re-entering the workforce. It didn't do that in 2010. "It wasn't negative. We weren't hemorrhaging jobs," he says. "But in the context of 10 percent unemployment, standing still isn't all that great."

In general, a weak U.S. dollar is favorable to stocks and commodities, with the benefit of the doubt going to stocks in emerging Asian countries since their debt burdens are small relative to developed nations. The short-term outlook for the U.S. dollar is somewhat mixed presently with the bulls having the upper hand over the last seven weeks. Recent action in the U.S. dollar, aided by growing concerns about ongoing weakness in housing, has left the door ajar for the dollar bears. The dollar is also under assault from the Fed's quantitative easing program (a.k.a. money printing).

On December 17th, we noted the dollar had recently completed two of the three steps usually associated with a change in trend. As shown in the chart below, the dollar has been unable, thus far, to complete the third step, which is to close above 81.19. Recently, the dollar has made a lower high, which leans bearish (compare point A to point B). The Rate of Change (ROC – see bottom) indicator also tells us the recent push higher was lacking conviction from buyers (compare A1 to A2 below). As of the close on December 30th, nothing was settled from a very short-term perspective.

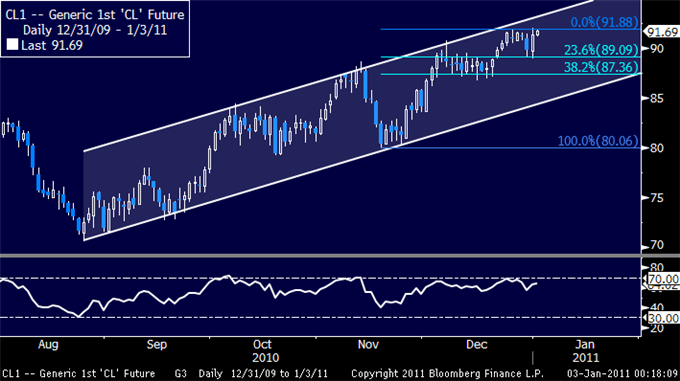
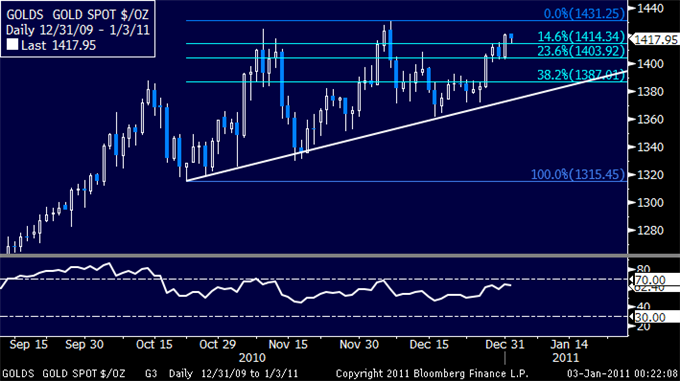
For now, the dollar sits in a technical no man's-land from a short-term perspective. A close below 79.29 would increase the odds of a resumption of the greenback's longer-term downtrend. Should the bears regain control of the dollar, it would continue to favor commodities such as copper (JJC: 59.10 0.00 0.00%), silver (SLV: 30.18 0.00 0.00%), oil (USO: 39.00 0.00 0.00%), and agriculture (DBA: 32.35 0.00 0.00%). Significant weakness in the dollar may be followed by a resumption of leadership by emerging market stocks (EEM: 47.642 0.00 0.00%) relative to U.S. stocks (SPY: 125.75 0.00 0.00%).

With a six-to-twelve month time horizon, favored sectors for 2011 include energy (XLE: 68.25 0.00 0.00%) and materials (XLB: 38.41 0.00 0.00%). Strength in these sectors tends to be associated with periods of weakness in the U.S. dollar. From a bullish perspective, we could see strength in energy and materials, coupled with strength in the dollar, if U.S. growth, housing, and/or employment surprise on the upside, but that may be an ambitious scenario. Our 2011 outlook for stocks does not rule out better than expected economic outcomes in the first of 2011, based on recent technical deveopments.

We will continue to monitor the U.S. housing and labor markets along with relative moves in global currencies. Markets have a lot of moving parts; keeping an open mind, paying attention, and remaining very flexible are sound practices for all investors.

Friday, January 7, 2011

Crude Oil Grinds Higher On Outlook, Gold Edges Lower After 30% Gain In 2010

Commodities – Energy

Crude Oil Grinds Higher on Outlook

Crude Oil (WTI) – $91.71 // $0.33 // 0.36%

Commentary: Crude oil is kicking off the new year on a positive note, with WTI rising close to $92 and Brent surpassing $95 in overnight trade. Loose monetary conditions and a strong economic outlook remain the two bullish underpinnings of crude. Prices will likely gravitate higher as long as news flow stays positive. We would wait for the inevitable correction, however, before initiating fresh long positions. An excerpt from our latest special report:

"All things considered, benchmark crudes have accounted for quite a bit of bullishness with prices sitting in the mid-$90's. There will likely need to be evidence that the market has tightened more-than-expected before a move into the triple digits. As stated [previously], the bullish wildcard is demand growth from developed economies, while the bearish wildcard is non-OPEC supply. Additional variables to consider include China's demand growth as the country's central bank tightens monetary policy and OPEC crude supply as Iraq lifts production and quota compliance falls due to higher prices."

Technical Outlook: Prices are range-bound between $91.88 – the recent swing high – and the 23.6% Fibonacci retracement at 11/17-12/27 rally at $89.09. A break higher exposes the top of a rising channel set from August at $93.22 while a reversal lower exposes the 38.2% Fib at $87.36.

Crude_Oil_Grinds_Higher_on_Outlook_Gold_Edges_Lower_After_30_Percent_Gain_in_2010_body_01032011_OIL.png, Crude Oil Grinds Higher on Outlook, Gold Edges Lower After 30% Gain in 2010

Commodities – Metals

Gold Edges Lower After 30% Gain in 2010

Gold – $1416.95 // $3.83 // 0.27%

Commentary: The numbers are officially in—gold rose 29.5% in 2010, its tenth straight annual gain. Prices closed out the year just shy of the record nominal high of $1431.25. The fact that the U.S. Dollar fell for seven straight sessions to close out the year helped give a final boost to gold.

Can the bull market continue in 2011? All the ingredients are still there for gold to continue its rally—investor interest remains high, with demand from China, in particular, surging. Furthermore, this interest has been consistent, as flows into gold ETFs have risen steadily since these financial products were introduced almost seven years ago.

2011 will be interesting, however, as it may be a transition year. By the end of 2011 we may actually see the major central banks begin to tighten monetary policy. As rates in the U.S., for example have been flat since the end of 2008, this will be a dramatic shift that could spur profit-taking in gold.

Technical Outlook: Prices have taken out resistance at $1414.34, the 14.6% Fibonacci retracement of the 10/22-12/7 rally, with the bulls now poised to challenge the record high at $1431.25. The 14.6% level has been recast as near-term support.

Silver – $30.82 // $0.10 // 0.33%

Commentary: Silver advanced an incredible 83% in 2010, as investor interest shifted meaningfully in favor of the cheaper precious metal. At one point in 2010, the gold/silver ratio hit a high of almost 71, but by the end of the year the ratio plunged to 45, the lowest since early 2006. The culprit was aggressive investment flows into the metal, especially via financial products such as ETFs. Silver ETF holdings rose by almost 100 million troy ounces to 485 million over the course of the year. That is significant in a market that is roughly 900 million troy ounces in size.

The gold/silver currently stands at 46, near the lowest levels since April 2006. (The gold/silver ratio measures the relative performance of the two precious metals. A higher ratio indicates gold outperformance, while a lower ratio indicates silver outperformance).

Technical Outlook: Prices set a new 30-year high last week but positioning hints a reversal lower is ahead. Prices have carved out a bearish Rising Wedge formation since early November, a setup reinforced by clear-cut negative divergence on RSI studies. Confirmation of a downward breakout requires a daily close below the wedge bottom, now at $29.39. More immediate support lines up at $30.17.

Crude_Oil_Grinds_Higher_on_Outlook_Gold_Edges_Lower_After_30_Percent_Gain_in_2010_body_01032011_GLD.png, Crude Oil Grinds Higher on Outlook, Gold Edges Lower After 30% Gain in 2010


Thursday, January 6, 2011

Bear Of The Day: FTI Consulting (FCN)

FTI Consulting's (FCN: 37.28 0.00 0.00%) third quarter 2010 earnings were below the Zacks Consensus Estimate. The company's corporate/restructuring segment remains a drag on its growth due to softer trend in restructuring activities and a slowdown in new cases.

The company is also experiencing a tepid pace of recovery in the Merger & Acquisition markets. Overall, the near-term visibility remains unclear, as demand environment for practices remains uncertain given the current market volatility and clients cautious aggregate spending.

Going forward, we remain skeptical about the growth prospects of the company. Hence, we maintain an Underperform rating on the stock.

Wednesday, January 5, 2011

How To Trade Gold, Stocks And ETFs In 2011

I hope everyone had a great holiday and new years!

It's time to reset our profit counter to zero and start looking for new profitable trades along with managing our current open positions on our small cap stocks which we continue to hold with gains of 66%, 35% and 10%.

Last year was a tough one as the stock market chopped around in a very large range giving off buy and sell signals every week and some times every other day…

Those who follow me or trade with me through my trading newsletter know how conservative I am when looking for low risk setups in both ETFs and stocks. And no doubt agree there were some extended periods of time when we did not have any trades because the volatility on a daily basis was making it the risk higher than what I wanted us to take, thus we waited for setups instead of chasing prices. We still locking in some solid gains with 8 winning trades, but feel we can better this year especially if we get less chop and more of a trending market.

It's safe to say some people just do not like being in cash, hence the reason so many want stock picks and trades all the time. But to be flat out honest, I love being in cash or at least holding a good chunk in cash waiting for a high probability opportunity to pop up on my charts before committing my hard earned cash. It's better to be wishing you were in a trade than to have all your money tied up in losing positions just because you wanted to be active… Because I give you only the trades I am making with my own money, I think that is the reason things are slower paced, unlike some other newsletters in this industry which fire off new trades each day or week just to keep those addicted (wanting stocks picks all the time) happy.

Anyways, 2011 should be a great year for trading, investing and education. Last year's fast paced market I know either took your money and got you really frustrated, or you made money and was able to use the difficult conditions to fine tune your trading and money management stills like I did. 2011 feels like it's going to start out similar to 2010 where we get a move up into mid January, but once earning season starts the market sells off on the good news for an 8-10% correction.

The good news is that after last years fast paced market and my constant refining of my strategy and money management rules, we should be able to catch the majority of the trends this year both up and down using stocks, regular ETFs and Inverse ETFs.

As much as I would like to forecast what I think will happen this year, I have decided to take the market one quarter at a time to keep everyone more in tune with what's happening now and a glance forward up to 2-3 months.

Take a look my SP500 charts for the next 3-8 weeks below.

SP500 Index – Daily Chart

On this chart you can see that the overall trend right now is still clearly up. But with this current situation I feel one should be on the sidelines waiting for the market tip its hand telling us its headed higher or lower. If it prices start to fall we will look to short the market in order to profit from the correction as long as the market provides an optimal opportunity.

Currently the market sentiment levels are at extreme highs, which is the same as last January and April's highs. With extreme sentiment, light volume (lack of buyers) and earning season just about to start I cant help but think a nice correction is about to take place which will cleanse the market before the next big leg higher.

If all goes according to plan we should see an 8-10% correction. A pierce of the November low is what I am looking for as that would trigger a lot of protective stop orders and create panic selling in the market. It is panic selling which creates a market bottom. That being said we may not get that large of a correction which is why we must continue to monitor the market closely as my analysis will change with the market.

Jan 2010 SP500 Correction

This time last year the market was in a very similar situation with market sentiment, light volume, and earning season just around the corner…

It's difficult to pick tops because they can stay overbought for an extended period of time, bottoms are a little different simply because fear is more powerful than greed and shows it's self on the charts once you know what to look for and how to trade it. My point here that you should not jump the gun and start shorting just because you think one is around the corner. I prefer to wait for more of a clear signal that sellers are in control then ride the short term down trend and hope it blows up into the correction I think we are about to see.

During bottoms there are new low washouts, and the same goes for tops, we get several small new highs just before the price rolls over, and that has yet to happen.

Weekend Market Trend Conclusion:

In short, 2011 should have several great plays as I am looking at the SP500, Precious Metals, Oil, US Dollar, Bonds and Emerging Markets for some big moves.

Tuesday, January 4, 2011

Euro Zone Manufacturing PMI Rises More-than-expected

Forex Pros – Manufacturing activity in the euro zone increased more than initially forecast in December, rising to an 8-month high, industry data showed on Monday.

In a report, market research group Markit said that its euro zone manufacturing PMI rose to a seasonally adjusted 57.1 in December, compared to a preliminary reading of 56.8.

Analysts had expected the manufacturing PMI to rise to 56.9 in December.

On the index, a reading above 50.0 indicates industry expansion, below indicates contraction.

According to the data, the level of the PMI has remained above the neutral 50.0 mark for 15 months in a row.

Commenting on the report, Chris Williamson, chief economist at Markit said, "Germany remained the star performer, seeing near-record growth, followed by France, where the PMI slipped only slightly from November's ten-year peak. However, welcome signs of recoveries were also evident in the periphery, where export sales helped boost output growth in all cases except Greece, where the rate of decline at least moderated."

He added, "The data suggests that the manufacturing recovery may be broadening out to help lift economic growth outside of the French-German core in early 2011."

Following the release of the data, the euro was down against the U.S. dollar, with EUR/USD tumbling 0.62% to hit 1.3306.

Meanwhile, European stock markets were broadly higher. The EURO STOXX 50 climbed 0.66%, France's CAC 40 jumped 1.39%, Germany's DAX surged 0.87%, while the FTSE 100 was closed due to the New Year's holiday.

Monday, January 3, 2011

Stocks Markets – Anticipating Economic Growth?

This article is a combination and update of two posts published separately a few weeks ago.

Stock markets have been heading north over the past few weeks while market commentators question the health of the world economy and especially the situation in the U.S. and China. But who is right and who is wrong? This very question prompted me to look at the ability of stock markets to anticipate the fortunes of the underlying economies.

The methodology I applied was to calculate Monthly Smoothed Annualized Growth Rates (MSAGR for short) of the major representative stock exchanges and compare that with leading indicators of the respective economies where possible. To calculate the MSAGR I compute a weighted index on the basis of increased weights for the past 12 months instead of using a simple moving average. The most recent value therefore carries a significantly higher weight than that of the first month of the past 12 months. The weighted index is then smoothed by calculating a 4-month moving average of the weighted index. The month-on-month growth rate is then calculated and annualized.

In the graph below, I have depicted the MSAGR of the S&P 500 Index against the 12-month momentum of the USA Composite Coincident Indicator and it appears that the MSAGR of the S&P 500 leads the coincident indicator and therefore the U.S. economy by approximately four months.

Sources: I-Net; Plexus Asset Management.

What is remarkable is that in all instances when the MSAGR fell below zero, growth of the U.S. economy as measured by the coincident indicator declined approximately four months later, except in 1994 when the MSAGR only briefly turned negative.

As in 1994 the MSAGR briefly turned negative in August this year at -1.17% but bottomed and soon moved to positive territory again. The message I am getting is that the slowdown in growth of the U.S. economy in recent months is something of the past and that the first quarter of 2011 will show improvement. It is clear that those at the Fed are heavily influenced by the trend in the stock market and therefore felt strongly about implementing QE2 to prevent the ship from sinking.

The Eurozone displayed characteristics similar to those of the S&P 500 Index and MSCI World Index in US dollars. The zero line is of utmost importance. When the MSAGR of the Eurozone breaks decisively into negative territory it heralds a drop in economic activity approximately four months hence. A few months ago (in September) it came precariously close but rebounded, indicating that the leading indicator of the Eurozone has likely gained momentum.

Sources: I-Net; Plexus Asset Management.

Germany was the stalwart in the Eurozone, though. Although the Dax's MSAGR trended down, it never came close to zero.

Sources: I-Net; Plexus Asset Management.

Elsewhere in the Eurozone things did not look rosy. Even France's relatively strong economy became extremely vulnerable as indicated by the stock market's smoothed growth rate. The MSAGR of the CAC 40 appears to have bottomed and is heading for positive territory.

Sources: I-Net; Plexus Asset Management.

The outlook for the economies of the so-called PIIGS, the Eurozone's problem children, is dire, though. Greece's stock market prices are anticipating a deep recession.

Sources: I-Net; Plexus Asset Management.

A similar picture is evident for Ireland.

Sources: I-Net; Plexus Asset Management.

Italy's stock market is holding up reasonably well, indicating that the economic outlook is less bad than anticipated.

Sources: I-Net; Plexus Asset Management.

Although the smoothed growth rates of the stock markets in the Iberian Peninsula indicate contraction of the economies in Portugal and Spain, it is relatively shallow and appears to have hit bottom.

Sources: I-Net; Plexus Asset Management.

Sources: I-Net; Plexus Asset Management.

The MSAGR of the FTSE 100 briefly dropped to below zero but staged a strong rebound, indicating that the market is anticipating stronger economic activity in coming months.

Sources: I-Net; Plexus Asset Management.

In the Far East investors in the Japanese stock market are significantly less optimistic than the momentum of the official leading indicator suggests. However, the stock market's smoothed growth rate is heading for positive territory again.

Sources: I-Net; Plexus Asset Management.

Using the same algorithm, I calculated the MSAGR for the MSCI World Free Index in U.S. dollars and compared it to the 12-month momentum of the OECD Leading Indicator. While there is a close relationship between them, the MSAGR of the MSCI World Free Index is in fact more reliable than that of the OECD Leading Indicator. It was especially evident in 2002 when the OECD Leading Indicator's momentum turned positive while the MSAGR stayed in negative territory and therefore did not fall into the trap of the double-dip in global economic activity. In fact, since the start of last year the MSAGR of global stocks has led the OECD Leading Indicator's momentum.

Sources: I-Net; Plexus Asset Management.

My MSAGR of the MSCI Emerging Market Index in U.S. dollars had a solid uptrend that started when the Asian crisis ended at the end of 1998 but collapsed in 2008 with the Lehman saga.

The MSAGR of the MSCI Emerging Markets Index in U.S. dollars follows the same trend as that of the MSCI World Free Index in U.S. dollars. The growth is more elevated, though, and indicates the stronger growth in emerging economies compared to mature economies. It is interesting to note that unlike mature markets the MSAGR of emerging markets did not bottom in negative territory recently.

Sources: I-Net; Plexus Asset Management.

In South America the Argentine bourse is anticipating stronger economic growth in the near future.

Sources: I-Net; Plexus Asset Management.

The Brazilian market players do not share the optimism of their Argentine partners, though.

Sources: I-Net; Plexus Asset Management.

It is no wonder the Brazilians and Russians are crying foul about the strength of their currencies!

Sources: I-Net; Plexus Asset Management.

The smoothed growth rate of India's stock market has resumed an uptrend into positive territory.

Sources: I-Net; Plexus Asset Management.

Commentators are still focusing on the extremely weak OECD Leading Indicator for China and the potential effect thereof on the Chinese stock market. The MSAGR of the Shanghai Composite Index has bottomed in negative territory, though. It indicates to me that yes, economic growth is likely to slow in the next few months but it will be short-lived as the smoothed growth rate of the Index is again approaching positive territory.

Sources: I-Net; Plexus Asset Management.

Looking at my home country, South Africa, it is evident that the MSAGR of the South African stock market in local currency [[rand]] terms leads the economy as measured by the momentum of the SA Coincident Indicator by approximately four months. The MSAGR therefore points to the slowdown in growth of the SA economy bottoming in the final quarter of 2010 and activity strengthening in the first quarter of 2011.

Sources: I-Net; Plexus Asset Management.

Bottom line: The stock market is probably right regarding an improved global economic outlook for the first quarter of 2011. Overbullish sentiment can turn quickly, though. With a number of black swans on the radar I will be keeping a close watch on the MSAGRs of the different markets.

Magic Software Expands Presence In Turkey With New Distributor

Senoglu Yazilim commits minimum of $700,000 over the next three years to Distribute Magic Software Products Throughout Turkey

OR-YEHUDA, Israel, Jan. 3, 2011 /PRNewswire/ — Magic Software Enterprises Ltd. (MGIC: 6.18 0.00 0.00%), a global provider of cloud and on-premise enabled application platform and business integration solutions, today announced an agreement with Senoglu Yazilim A S, a software solutions provider, for the distribution of Magic Software's products to new customers and partners throughout Turkey.

This new distributorship enables Magic Software to expand its long-term presence in Turkey with its major software products – the uniPaaS application platform and the iBOLT business integration suite. Senoglu Yazilim commits a minimum of $700,000 over the next three years to distribute Magic Software's products throughout Turkey.  

Senoglu Yazilim will focus on recruiting partners and customers for Magic Software's award-winning products and on selling its Magic Software technology-based health information system (HIS), which is in high demand in the Turkish market. The HIS enables health providers to automate workflows while saving time and money. Additionally, the company has several other projects in its pipeline.

Guy Bernstein, acting Chief Executive Officer of Magic Software, said, "We are very pleased to be working with Senoglu Yazilim, a well-known and highly experienced IT distributor in Turkey. This highly anticipated agreement will help us increase our presence in Turkey and our customer reach to Turkish enterprises and ISVs enabling them to cost effectively create, deploy and integrate both on-demand and on-premise applications."

"The distribution agreement we have signed with Magic Software will answer the strong demand for Magic Software's development and integration solutions in Turkey. We are excited about moving forward with the added edge that this distributorship provides our company. The affordable pricing model makes it attractive to both mid-sized businesses as well as larger corporations," said Orhan Senoglu of Senoglu Yazilim.

The uniPaaS application platform enables enterprises and software vendors to build client/server applications and rich internet applications (RIA) targeting the latest technologies such as Cloud computing, mobile phones and Software-as-a-Service (SaaS) offerings. The iBOLT business integration suite is based upon the same business-ready, code-free technology stack as uniPaaS. The product is able to simplify the integration of business applications including ERP, CRM, logistics, and supply chain management. Both products help companies achieve a higher return on investment (ROI).

About Senoglu Yazilim A.S.

Senoglu Yazilim A.S. is a Turkish provider of software tools for the development and implementation of state-of-the art business applications. Senoglu Yazilim is a joint venture of Turkish companies with a deep knowledge of software development, internet applications and cloud computing. The company has a channel of professional IT partners covering every area in Turkey. Senoglu Yazilim is mainly active in healthcare, finance, government, retail and production sectors.

About Magic Software

Magic Software Enterprises Ltd(MGIC: 6.18 0.00 0.00%) is a global provider of cloud and on-premise application platform solutions – including full client, rich internet applications (RIA), mobile or Software-as-a-Service (SaaS) modes – and business and process integration solutions. Magic Software has 14 offices worldwide and a presence in over 50 countries with a global network of ISVs, system integrators, value-added distributors and resellers, as well as consulting and OEM partners. The company's award-winning, code-free solutions give partners and customers the power to leverage existing IT resources, enhance business agility and focus on core business priorities. Magic Software's technological approach, product roadmap and corporate strategy are recognized by leading industry analysts. Magic Software has partnerships with global IT leaders including SAP AG, salesforce.com, IBM and Oracle. For more information about Magic Software and its products and services, and for more about Magic Software industry-related news, business issues and trends, read the Magic Software Blog.

Except for the historical information contained herein, the matters discussed in this news release include forward-looking statements that may involve a number of risks and uncertainties. Actual results may vary significantly based upon a number of factors including, but not limited to, risks in product and technology development, market acceptance of new products and continuing product conditions, both here and abroad, release and sales of new products by strategic resellers and customers, and other risk factors detailed in the Company's most recent annual report and other filings with the Securities and Exchange Commission.

Magic is the trademark of Magic Software Enterprises Ltd. All other trademarks are the trademarks of their respective owners.

Best Stocks To Buy Now